Measuring LinkedIn Creator Campaign Performance Beyond Impressions
Most LinkedIn creator value hides before prospects enter the sales pipeline.

The campaign report lands, and the numbers look good: strong reach, solid click-through, a chart trending up and to the right. Then someone from sales asks a simple question: which of those impressions turned into actual buyers? The room goes quiet, because nobody set up a way to answer that. Impressions count how many times a post showed up in a feed, nothing more. They say nothing about whether a single one of those appearances moved a buyer one step closer to a purchase. That disconnect is widened by the B2B sales cycle itself, long enough that months separate a single creator impression from a closed deal, so the causal thread stays invisible without deliberate tracking infrastructure.
Teams default to this number for reasons that have nothing to do with sloppiness. LinkedIn's own Campaign Manager hands marketers impression and click-through data the moment a campaign ends, while pipeline data sits behind a CRM integration that most teams never got around to building. Creator campaigns also tend to get bought the way media buys get bought: negotiated on reach, priced on reach, so the report that follows just keeps using the same currency the deal was struck in.
Creator content earns a budget line for a specific reason, and it's not the view count. Personal LinkedIn accounts generate substantially more impressions than company pages, and inbound replies sparked by founder or creator content convert at a dramatically higher rate than outbound outreach does. The channel earns its investment because it changes what buyers do rather than how many views it racks up. GrowthSpree's 2026 attribution analysis shows what the impression-first habit actually costs: last-click attribution makes LinkedIn look far worse than it performs, because most of its influence builds up during a long, silent education phase that happens before a prospect ever enters the pipeline. Cutting LinkedIn budget based on last-click cost-per-lead data causes pipeline to shrink months later. Almost nobody traces that drop back to the budget cut that caused it.
How the B2B buyer journey works
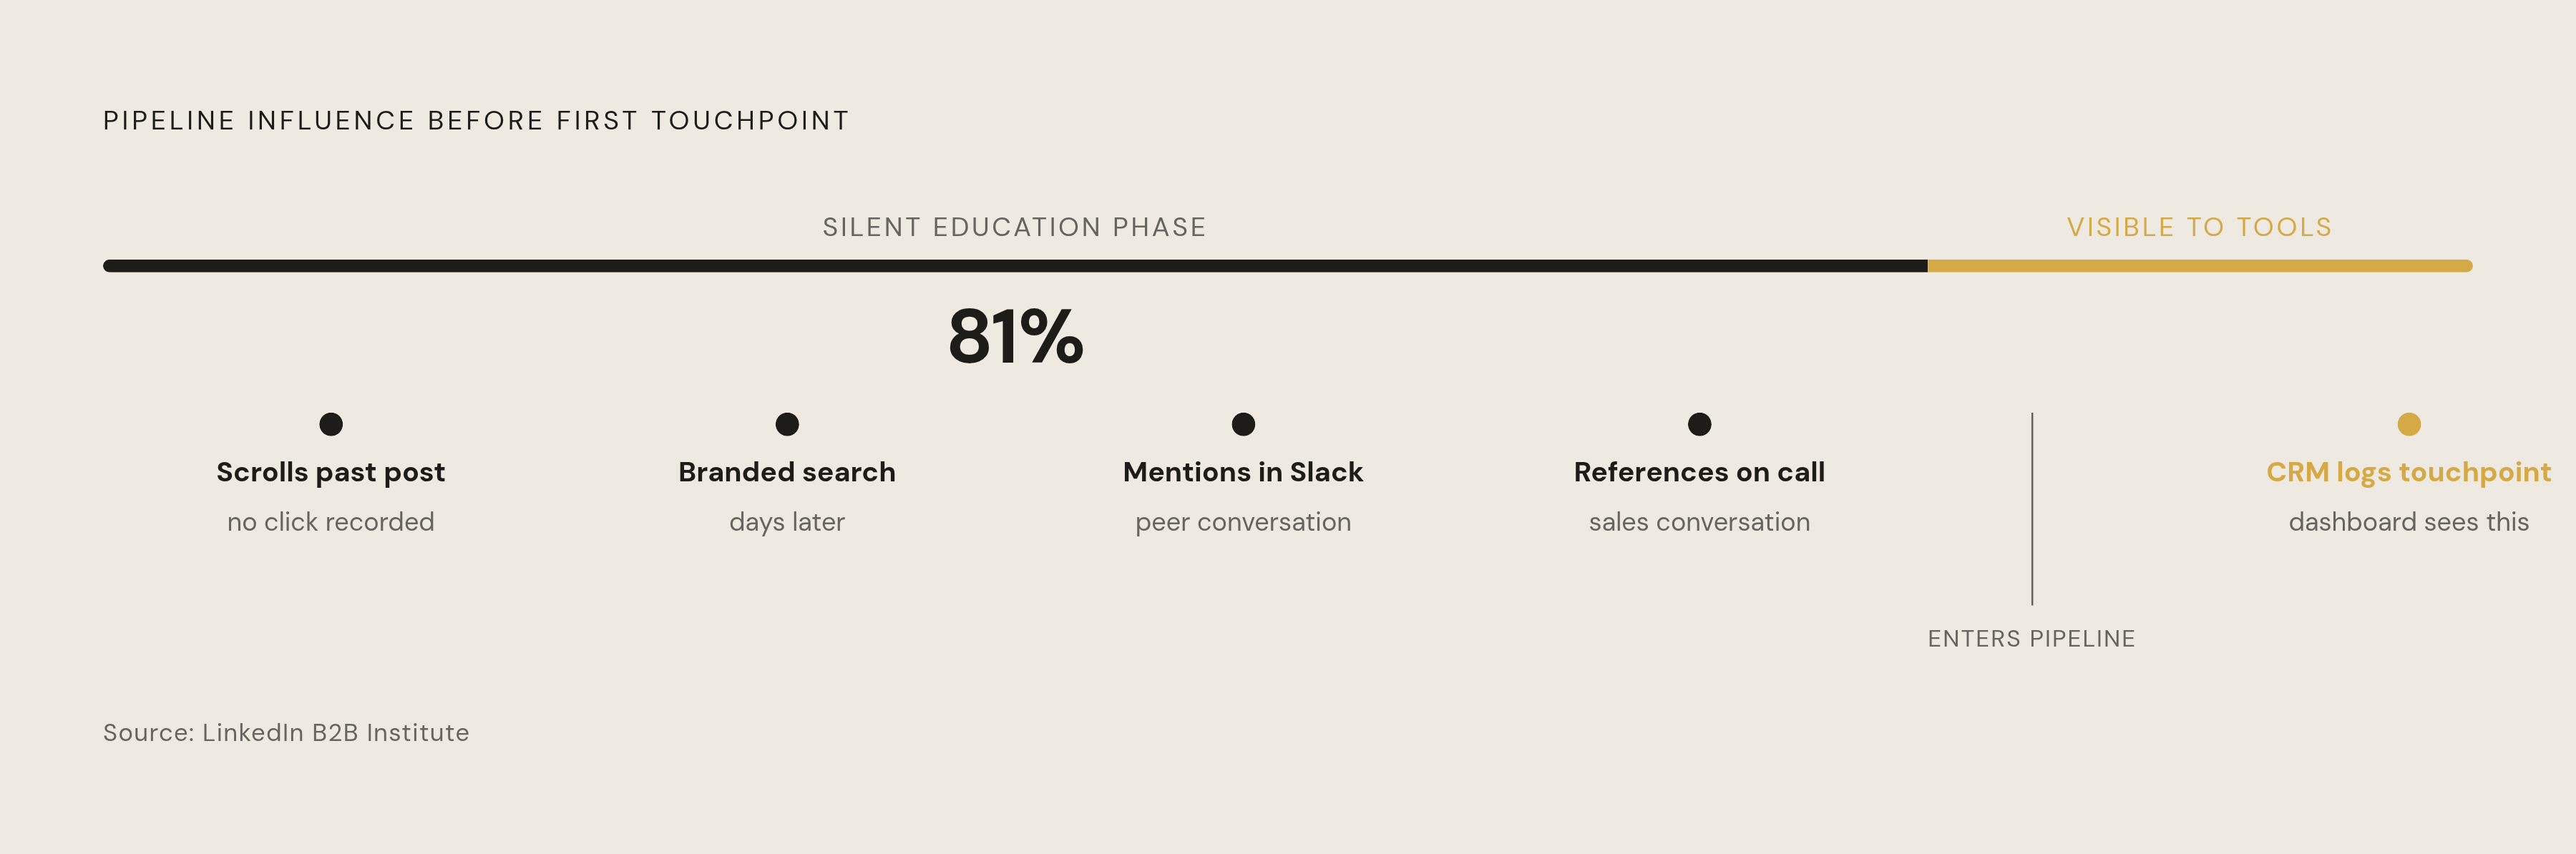
A B2B buyer rarely moves in a straight line from ad to click to purchase, and no attribution model built around a single click can capture what a creator post actually did along the way. Attribution has to be built around how the journey really unfolds, not stitched on after a campaign wraps.
Picture how one deal might actually form. A buyer scrolls past a creator's post on a Tuesday. No click, no form fill, nothing that any ad platform would record. The following week, that same buyer runs a branded search, triggered by a name or a concept lodged in memory from the post. Days later, the buyer mentions it in Slack to a colleague who never saw the original post at all. Weeks after that, a sales call opens with the prospect referencing something they read. The CRM dutifully logs the sales touchpoint. It has no record of the creator post that started the whole chain.
GrowthSpree's 2026 data puts a number on this pattern: 81% of LinkedIn's impact builds up before a prospect ever formally enters the pipeline. Branded search conversions and direct-traffic form fills visible in a dashboard are frequently just the visible tail end of creator exposure that happened months before. View-through conversions, prospects who saw a post without clicking and then converted somewhere else entirely, make up a substantial share of LinkedIn's real pipeline contribution once a team measures with a wide enough attribution window.
Buying committees make this harder still. A single form fill from one stakeholder says nothing about how many other people at that same account read or engaged with creator content before anyone opened an opportunity. Catching that requires account-level engagement data instead of contact-level tracking. Directive's 2026 analysis draws the line clearly: engagement numbers tell a team whether a message landed, but proving ROI means connecting creator-level tracking, CRM data, and the full cost of the program to actual customer value, accepting that some of the influence will never trace back to one click.
One real example shows the pattern in practice. That's the silent education phase turning into pipeline in front of a sales rep's eyes, with no click anywhere in the chain that a dashboard would have caught.
The attribution stack: five layers from click to closed revenue
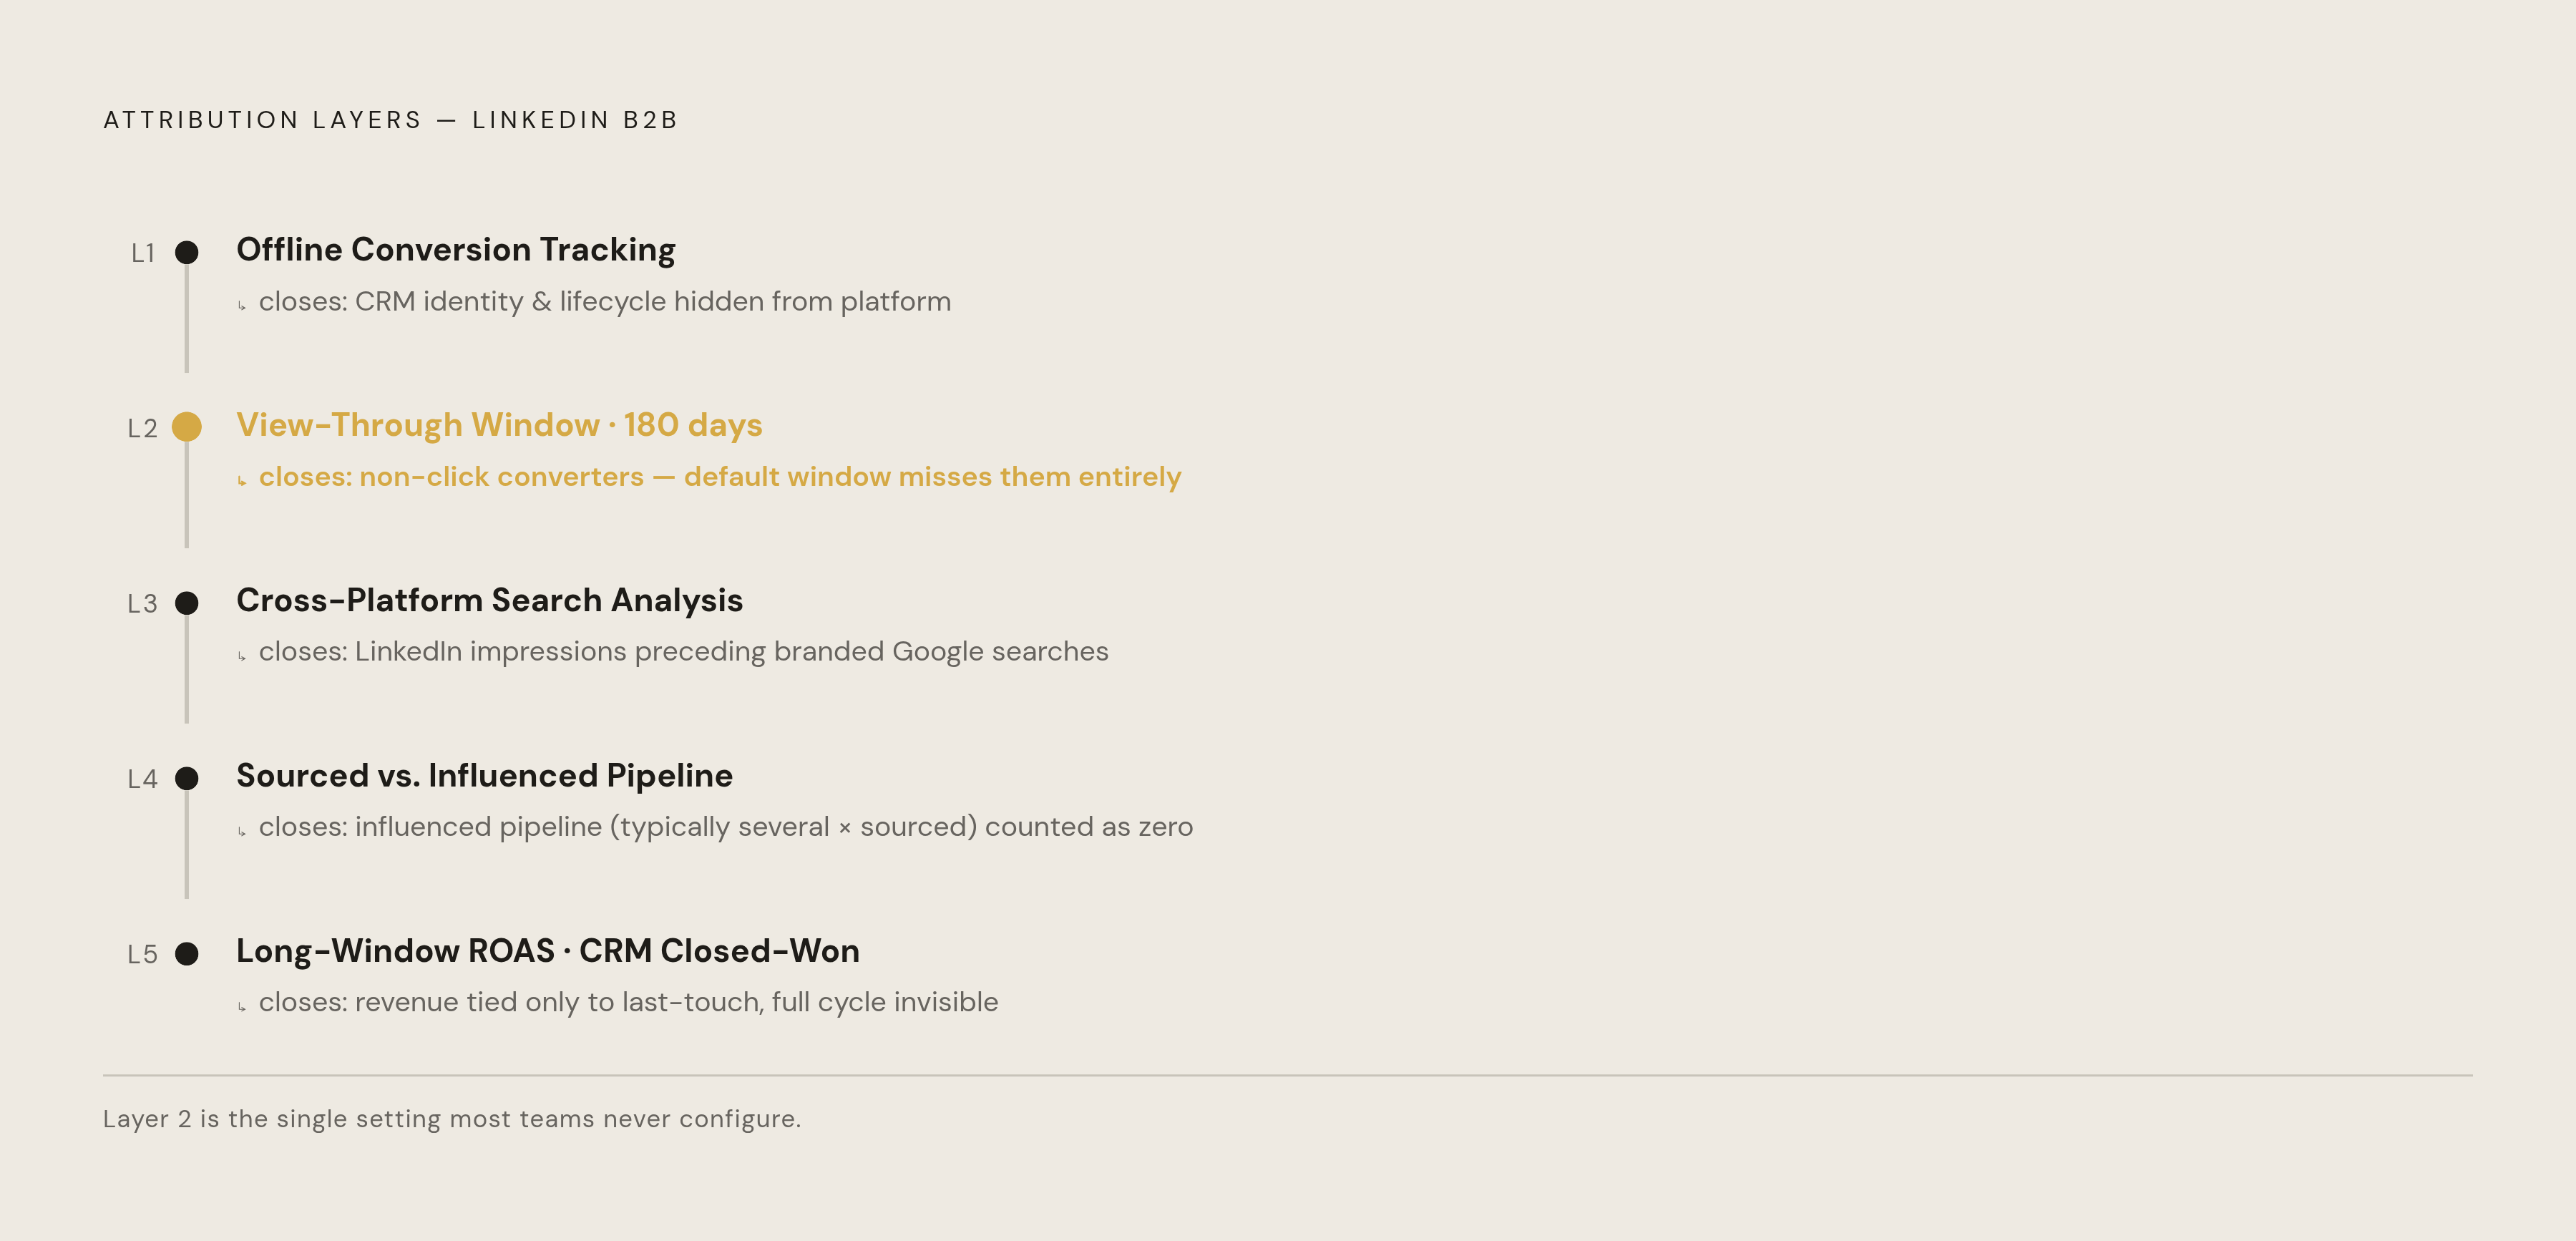
Catching creator influence accurately takes five separate measurement layers, stacked in sequence. Skipping any one of them leaves a team working from a partial picture, making budget calls on evidence that only tells part of the story. Each layer exists to catch something the layer below it cannot see.
Layer 1: Offline conversion tracking from CRM. This is the foundation everything else sits on. CRM lifecycle stages, lead, SQL, opportunity, closed-won, get connected to LinkedIn through identity matching, so that when a lead moves forward, LinkedIn Ads sees the downstream conversion instead of stopping at the initial form fill. Without this layer, every other layer measures inputs instead of outcomes.
Layer 2: Extended view-through attribution windows. View-through windows get set to the maximum available, 180 days for paid amplification of creator posts. That window catches prospects who saw a post without clicking and converted later through search or direct traffic. GrowthSpree's framework shows these view-through conversions make up a substantial share of LinkedIn's real pipeline contribution, a share that last-click models miss completely.
Layer 3: Cross-platform analysis connecting LinkedIn to search and CRM. This layer tracks how many branded Google searches were preceded by a LinkedIn creator impression. A significant share of branded search pipeline carries a LinkedIn touchpoint that standard reporting never captures. This layer turns LinkedIn's silent education phase from invisible into something a team can actually point to.
Layer 4: Social-sourced versus social-influenced pipeline, separated and governed. Social-sourced means LinkedIn was the first or last touch in the journey. Social-influenced means LinkedIn touched a longer journey owned by another channel. Directive's 2026 framework finds that influenced pipeline typically runs several times larger than sourced pipeline. Both categories need their own definitions, shared sign-off across marketing, RevOps, sales, and finance, and deduplication rules so multiple channels can't claim the same closed deal in full.
Layer 5: Long-window ROAS connected to CRM closed-won data. Measured early, LinkedIn's return on ad spend tends to look weak. Given the full length of an enterprise SaaS sales cycle, it frequently matches or beats other paid channels.
Any team that installs fewer than all five layers is measuring a partial view and making budget decisions on incomplete evidence. Identity matching across systems, 180-day tracking windows, cross-platform search analysis, governance meetings across four departments: this is real operational work, not a checkbox on a campaign brief. The next section covers the commercial language that makes the work worth doing.
The financial metric that gives creator campaigns a seat at the budget table
Once the five-layer stack is tracking pipeline accurately, a creator program needs one number that marketing, sales, and finance can all look at and agree on. That number is gross margin-adjusted LTV divided by fully loaded CAC, the same standard used to judge every other acquisition channel a company runs.
Gross margin-adjusted LTV matters more than raw bookings or revenue because total bookings flatter a program that happens to attract low-margin customers. Adjusting for gross margin reflects what a customer actually contributes in profit rather than the sticker price of the deal. Retention and expansion belong in the calculation too: a cohort of accounts exposed to creator content that sticks around longer or expands faster than the baseline customer has a genuinely higher LTV than the blended company average would suggest. Measured against the blended number instead, a program that's attracting the stickiest customers in the business looks worse than it is.
CAC needs the same honesty applied to cost as LTV applies to value. Fully loaded CAC means creator compensation, agency fees, production costs, paid amplification, the technology stack, internal labor, and sales costs, not just the media spend line item. Directive's 2026 framework is specific about this: reporting media spend alone understates the true cost of the program, producing a ratio that finance throws out the first time anyone audits it.
Real numbers make this concrete. Igor Gorbenko's reporting for Ahrefs adds the per-post angle: marketing-niche creators typically charge anywhere from several hundred dollars to a couple thousand dollars per post. Together, those two figures reveal both the program-level and per-unit economics a team is working with before a single dollar of pipeline appears.
The sequencing matters as much as the formula. Directive's 2026 guidance is direct about this: set cost boundaries, cohort definitions, and reporting windows only after results come in, and those definitions start shifting the moment performance gets uncomfortable. Marketing, RevOps, sales, customer success, and finance need to sign off on cost boundaries, cohort definitions, and reporting windows before the first campaign ever launches. Done this way, the ratio becomes the test that actually matters: a creator generating fewer leads than a competitor can still be the better investment if the accounts that creator brings in close more often, buy bigger contracts, or stay longer. Raw lead count hides that. The ratio reveals it.
Leading indicators that tell you the program is working before pipeline closes
Pipeline and LTV:CAC both take months to materialize. By the time either number confirms a campaign is failing, the budget for that campaign is largely already spent. Leading indicators exist to fill that gap, giving a team a real-time read on whether influence is building or stalling while the lagging numbers are still months from landing.
Creator-level engagement rate is the first of these, though it's a directional signal, not proof of ROI on its own. InfluenceFlow's 2026 analysis found niche and micro B2B experts average roughly 6% engagement, well above what macro creators typically post. A creator running below the benchmark for their size tier merits a closer look, since pipeline data won't reflect that underperformance for months. Quality counts more than the raw rate: comments from job titles that match the ideal customer profile, inbound DMs referencing specific points from a post, and shares landing inside target-company domains all carry more weight than a pile of generic likes.
Account-level engagement is the bridge between creator content and pipeline a team can actually watch build in real time. When employees at a target account start engaging with or resharing creator content before any sales rep has reached out, that's measurable proof the silent education phase is doing its job, and catching it requires company-level analytics rather than contact-by-contact tracking. Factors.ai's 2026 guide to LinkedIn ads analytics makes the point directly: analytics that show how entire accounts interact with ads across multiple touchpoints are what separate sophisticated measurement from basic reporting.
Thought Leader Ads, the format LinkedIn uses to boost creator posts with paid spend, give a third signal through CTR and cost-per-click performance. ZenABM's LinkedIn ABM Performance Benchmarks Report found Thought Leader Ads pull substantially higher click-through rates than standard single-image ads, and Fractional Demand's analysis of a large sample of LinkedIn ad spend found TLA cost-per-click running a fraction of what standard formats cost. These benchmarks work as comparison points, not fixed targets: actual performance still depends on the audience, the content, and how well that audience matches the ICP. A Thought Leader Ad falling short of these benchmarks points to a mismatch between the content and the audience, worth fixing in the creative brief before more budget goes toward the same post.
Branded search volume offers a fourth signal, one that needs no CRM integration at all. A rise in branded search during and after a creator campaign is an indirect but measurable sign that the silent education phase is building mental availability, and it's trackable straight out of Google Search Console. When a prospect opens a sales conversation by referencing specific creator content, the way the Drift and Gerhardt example illustrates, that directly shows whether the creator's audience actually overlaps with the ICP.
None of these five signals replaces the pipeline and LTV:CAC numbers built in the sections above. They're the instruments a team checks while waiting for those slower, heavier numbers to confirm what's already visible in the engagement data.
Why audience fit determines whether these metrics are worth measuring
The attribution stack and LTV:CAC ratio built on top of it only produce a meaningful number when the creator's audience actually overlaps with the brand's ideal customer profile. A creator whose audience doesn't match will still generate impressions, clicks, even form fills. The measurement infrastructure built across every section above will do its job correctly and identify all of it as worthless.
That makes creator selection the single highest-leverage decision in the entire program. Accurate attribution requires five distinct measurement layers working in sequence, and none of it matters if the audience on the other end of the post was never going to buy. The follower count on a creator's profile says nothing about whether those followers sit inside a company's ICP.
Audience fit belongs at the start of a creator program rather than as a factor to check once the numbers come back disappointing. Every layer of the attribution stack, the long view-through windows, the cross-platform search analysis, the social-sourced versus social-influenced split, exists to tell a team the truth about a campaign. Get the audience right, and the five layers, the LTV:CAC ratio, and the leading indicators all become instruments that sharpen decisions a team is already making in the right direction. Get it wrong, and the same instruments just measure, with increasing precision, how little happened.