Building a LinkedIn Creator Campaign Reporting Template for Stakeholders
Track pipeline and cost efficiency, not reach, to justify creator spending to revenue leaders.

A LinkedIn creator campaign report built for stakeholders has to lead with pipeline, not reach. The argument of this piece is simple: every section of a stakeholder-facing template should answer the question a CFO or VP of Revenue would actually ask, in the order they'd ask it.
Finance and leadership reject creator campaign reports built on reach and impressions
Picture a marketing leader who walks a budget review through a creator campaign report. The first three slides show impressions, reach, follower growth. The CFO skips past them and asks one question: "But what did it generate?" That moment is the whole problem in miniature, and it happens in budget reviews constantly, because most creator reports are built by people thinking like marketers instead of people thinking like finance.
Finance and revenue leadership judge every dollar of spend the same way, no matter what channel it ran through: what did it produce in qualified pipeline? A report that opens with impressions and reach is, by its own structure, admitting the channel can't be held to that standard. That admission has a cost. It invites a budget cut, or it gets the whole line item reclassified as brand spend. No one ever has to hold it accountable for performance again.
The fix is a different template, organized from the start around the questions a revenue leader asks, in the sequence they ask them. Everything that follows in this piece is that template, built one tier at a time.
The three-tier funnel structure that makes creator data legible to revenue stakeholders
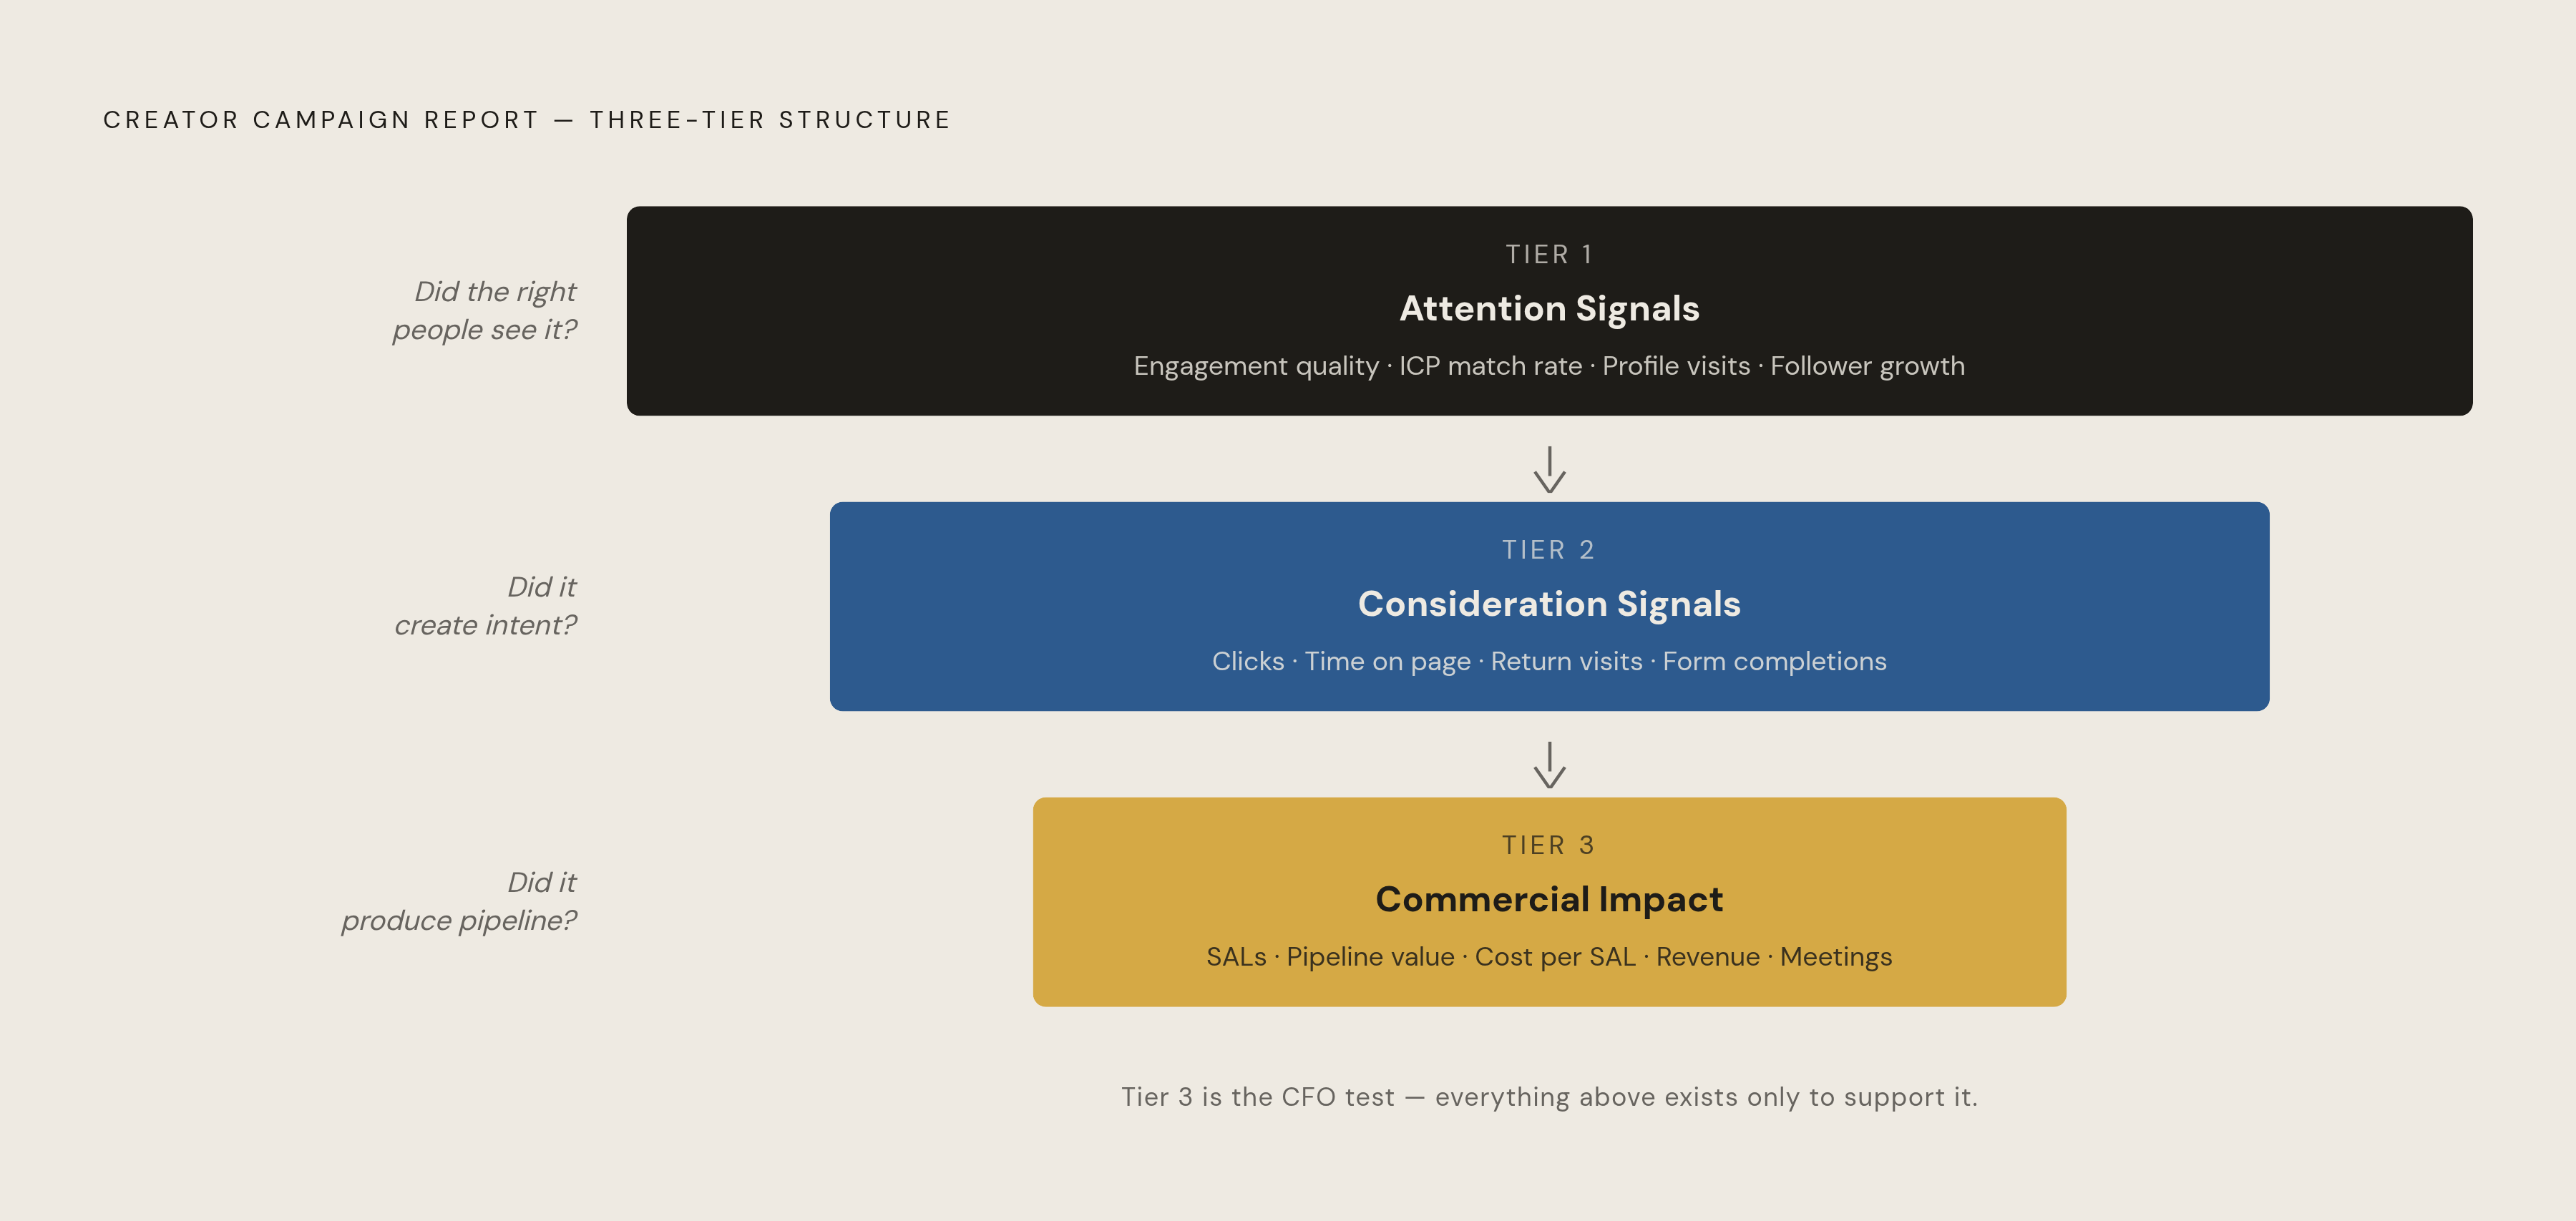
A pipeline-first creator report runs on three tiers: attention signals, consideration signals, and commercial impact. Each tier answers a sharper question than the one before it, and together they read like a funnel instead of a social media recap.
Tier one, attention signals, answers whether the right people saw the content. That means engagement quality (saves, reposts, comments from accounts that match the ideal customer profile), profile visits the post drove, and follower growth concentrated in the audience segments that matter. Tier two, consideration signals, answers whether the content created intent: click-through rate to the landing page, how deeply people engaged once they landed, return visits inside the campaign window, form starts, and content-assisted sessions. Tier three, commercial impact, answers the question that actually matters in a budget review: did this produce pipeline? That tier covers lead quality, influenced pipeline, meeting creation, cost per lead measured against other paid channels, and total influenced revenue.
One correction belongs in the template before any numbers go in it. LinkedIn's Campaign Manager has a default "clicks" column, and it overstates how efficient a campaign actually was, because it counts every click on the post, including clicks that just expand the post itself or open a profile. The number that belongs in a stakeholder report is "clicks to landing page," a separate column in Campaign Manager that isolates clicks heading toward an actual destination. Mislabeling this one field is one of the most common ways a creator report inflates its own numbers without anyone intending it to.
That's the frame the next two sections fill in.
The attention and consideration tiers for a non-marketing audience
A metric only earns trust with a non-marketing stakeholder once you translate it into a revenue-relevant question, because raw numbers, even good ones, read as vanity data if you don't live inside Campaign Manager. The template should give every row a label and a framing question, not just a number.
In the attention tier, the first row should be post impressions broken down by job title and seniority, producing what's best labeled ICP match rate: the share of impressions that actually landed on people who match the ideal customer profile. The framing question next to that row should read something like "Did this reach decision-makers?" That one field does more work than any other in the tier, because a raw impressions number means nothing to a revenue leader until it's filtered by who actually saw it. The second row should track saves and reposts as a share of total engagement, with a framing question like "Did this resonate enough to share?" The third row should count comments from accounts matching the target buying committee, framed as "Did the right people engage?" The fourth should track profile visits attributable to the campaign window, framed as "Did this drive interest in the creator or the brand?"
The consideration tier follows the same pattern, but it's built around intent, not attention. The first row is clicks to landing page, pulled from Campaign Manager's landing page clicks column rather than total clicks, framed as "Did they act on it?" The second row covers time on page and scroll depth from analytics, framed as "Did they engage with what they found?" The third tracks return visits within the campaign attribution window, framed as "Did this stay on their mind?" The fourth covers form starts and completions, framed as "Did this move them toward a conversation?" The fifth tracks content-assisted sessions, where a creator post sat somewhere in the path to conversion, framed as "Did this contribute even when it wasn't the last touch?"
If you build the template this way, every row carries its own explanation. A finance or revenue stakeholder should be able to read the report cold, with no presenter walking them through it, and should know what each number means and why it matters. That's also where creator-level detail starts to earn its place: the same rows should repeat per creator, so the report can show which creator's audience actually moved into consideration and which one only generated attention.
Building the commercial impact tier: connecting creator posts to leads, pipeline, and cost efficiency
The commercial impact tier is where a report either passes the CFO test or it doesn't. It needs to show three things, in this order: pipeline contribution, cost efficiency against named alternatives, and influenced revenue.
Pipeline contribution starts with sales-accepted leads sourced or influenced by the campaign, broken out by creator and by individual piece of content. From there, the template should pull total influenced pipeline value directly from the CRM, and it should compare deal velocity for influenced deals against non-influenced deals running in the same period. On the CRM side, this means pulling from the Opportunity object: the Primary Campaign Source field for single-touch attribution, or the Campaign Influence related list where multi-touch attribution applies. The working rule is that a touchpoint counts as influenced if it falls inside the 90-day window before the opportunity was created.
Cost efficiency is the number that makes or breaks the channel in a budget conversation: cost per sales-accepted lead from the creator campaign, set directly against cost per SAL from LinkedIn Ads and from content syndication or whatever other paid channels ran in the same period. Influenced revenue comes next: where CRM data supports it, you calculate it as total closed-won revenue where a creator touchpoint appeared somewhere in the multi-touch path. That figure should be labeled influenced revenue, not attributed revenue, because the multi-touch path doesn't support a claim of direct causation and the label needs to reflect that honestly.
Meeting creation rounds out the tier: the number of first meetings booked where the prospect self-reported a creator touchpoint, or where the CRM shows one inside the defined lookback window. It's the clearest bridge in the whole report between awareness and pipeline, because a booked meeting is a concrete commercial event, not an engagement proxy.
The tier closes with a cost breakdown row: total campaign investment, meaning creator fees plus platform and management costs, divided by sales-accepted leads. That produces a CPL finance can set directly next to any other line item in the budget.
Dark social's distortion of the commercial tier
Dark social is a systematic undercount of creator influence, because a large share of professional sharing happens in private Slack channels, email threads, and internal meetings that no tracking pixel ever touches.
That undercount has a direct consequence for the commercial tier: UTM tracking and Campaign Manager data alone will miss a real share of the people a creator post actually influenced, and that gap pushes the CPL number higher than it should be. A campaign can look less efficient than it is simply because the measurement system can't see where the influence actually traveled.
The fix belongs inside the intake forms. Adding a self-reported attribution field to the demo request, trial signup, or contact form, a single question like "How did you first hear about us?" with LinkedIn creator content listed as an explicit option, is the only way to capture this signal. Some stakeholders will push back on self-reported data as unreliable, and that objection is fair in most contexts. For dark social, self-reported data is the only signal that exists, and if you show it openly next to the tracked numbers, a finance audience will find it more credible than a known gap left unaddressed. List self-reported attribution leads as a separate line from UTM-tracked leads, then sum both into a total influenced lead count, so you can see the correction instead of burying it.
A second, supporting signal belongs in the same section: direct traffic spikes that follow a creator post by one to three days. When that pattern appears in the data, it's worth including as a correlated signal supporting dark social influence, labeled clearly as correlated rather than attributed, so no one mistakes it for a tracked number.
Categorizing creator campaign spend so it survives a finance review
Filing creator campaign costs under a general paid social budget line distorts both the measurement and how the channel gets perceived internally. Creator partnerships carry cost categories, like talent fees, content review, and exclusivity terms, that paid social budgets were never built to hold.
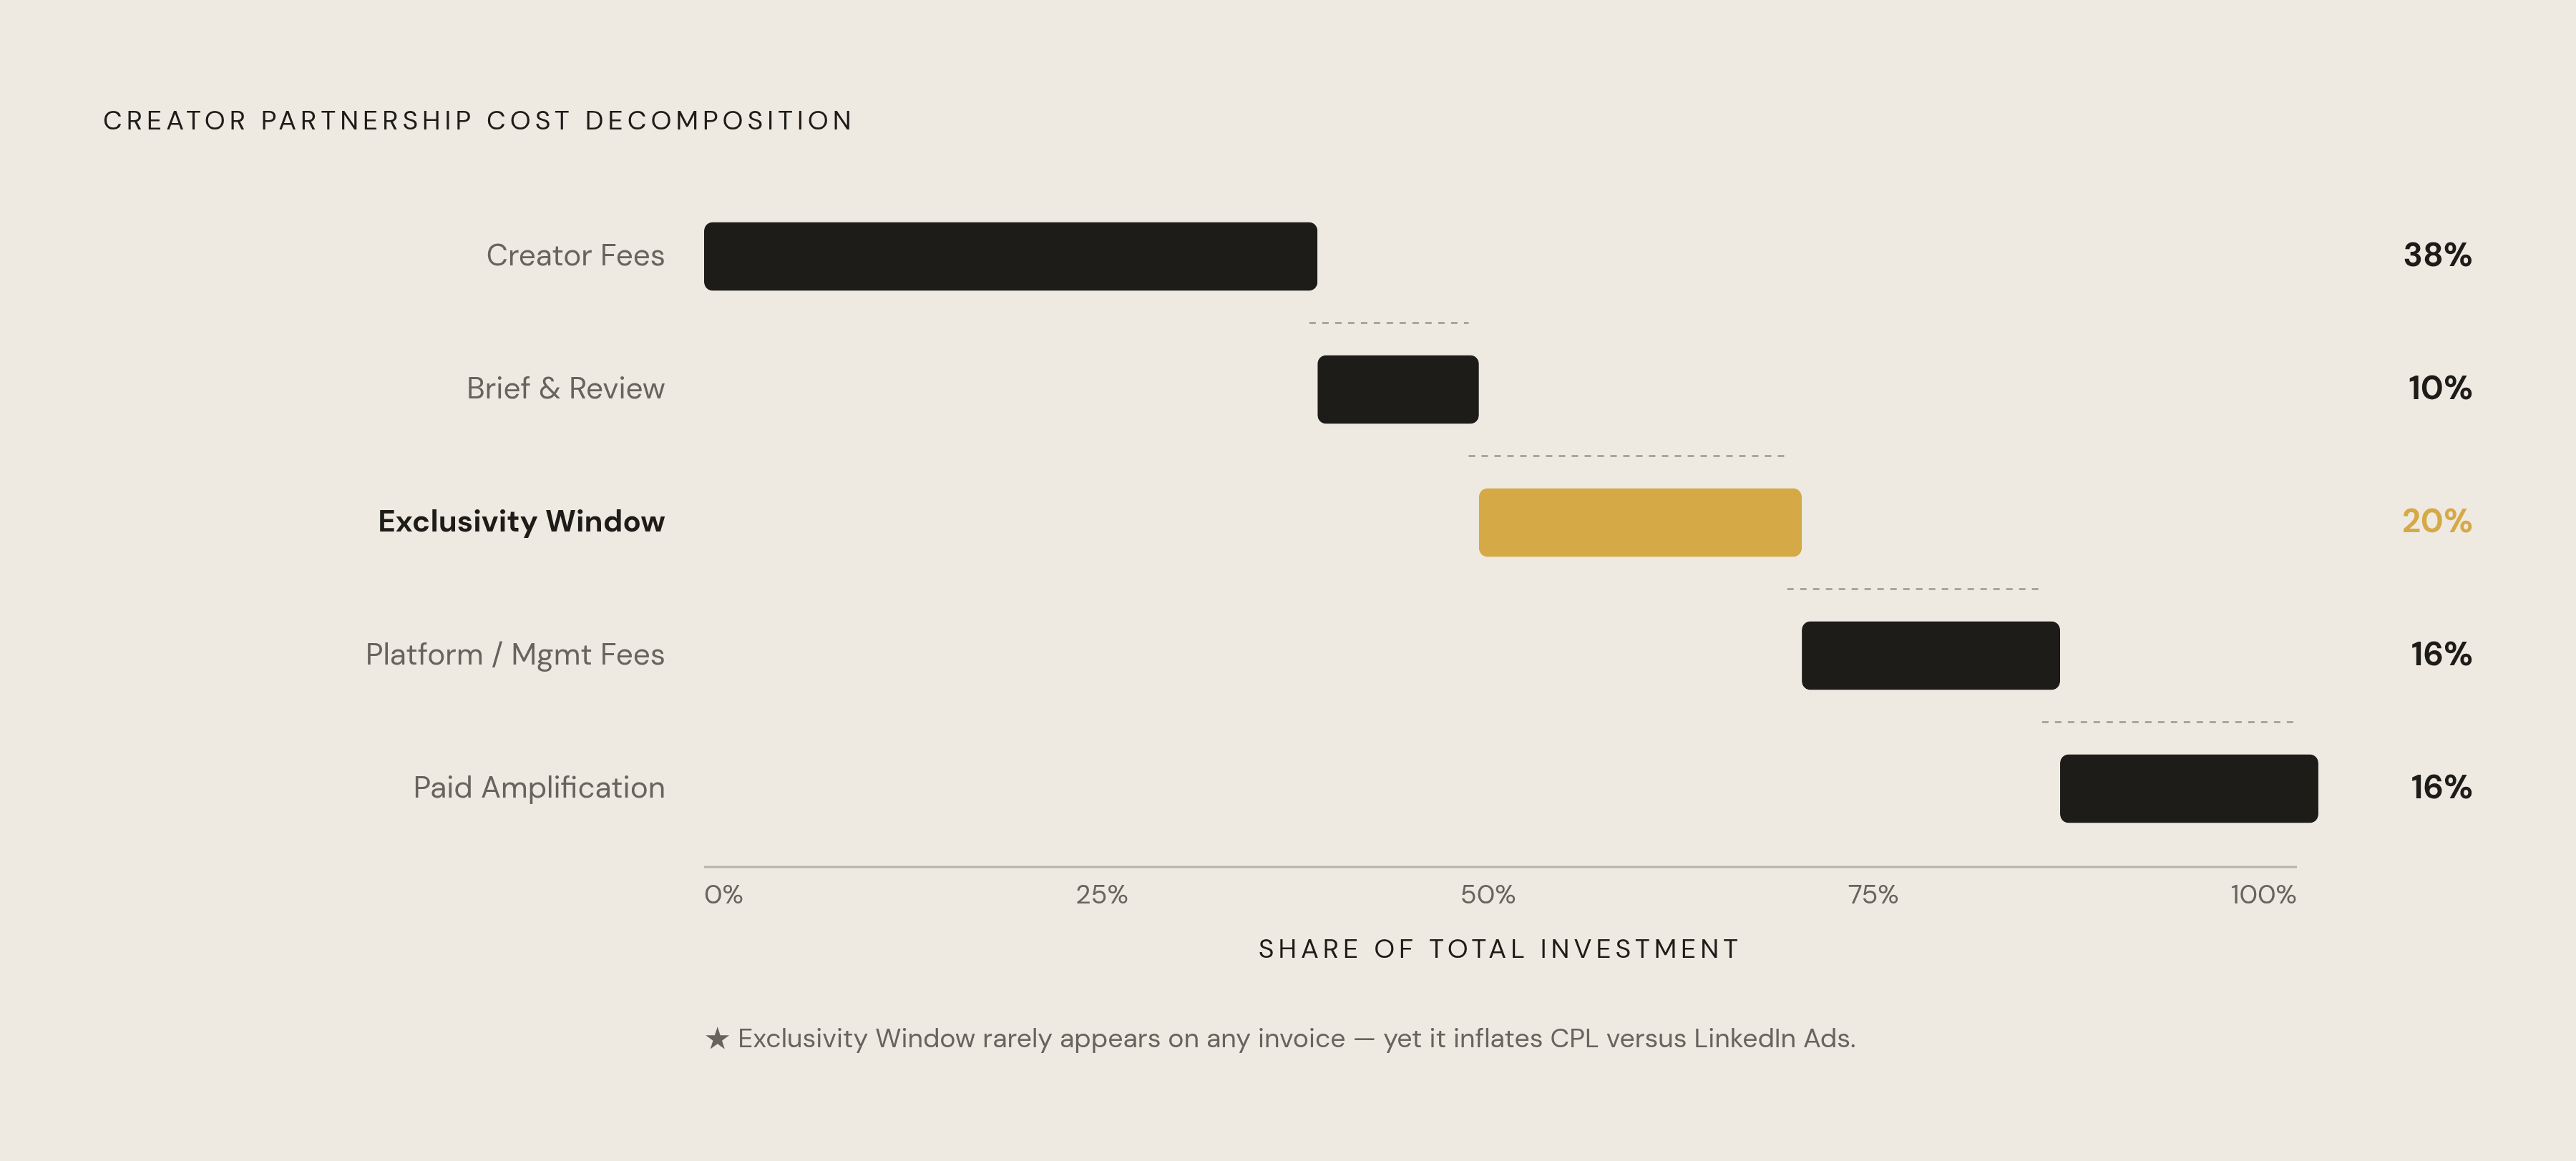
A LinkedIn creator partnership typically runs through five distinct cost types, and each one deserves its own named line in the investment summary. Creator fees cover the talent itself. Brief development and content review cover production. Exclusivity windows, the period during which a creator agrees not to work with a competitor, represent a real opportunity cost even when no invoice reflects it. Platform or management fees cover operations. Paid media is covered by paid amplification through LinkedIn's Thought Leader Ads, the official product for boosting an individual's organic post to a wider audience through Campaign Manager.
Folding all five into a single "paid social" line creates two distortions at once. It makes the campaign's CPL look worse than LinkedIn Ads, since the denominator now carries costs that LinkedIn Ads never has to absorb. And it makes the channel look more expensive overall, when several of those costs are one-time charges or get amortized across a longer program rather than repeating every cycle.
The template should instead present a cost waterfall: total investment broken into its five components, followed by a cost-per-outcome calculation that states which components went into that number. That one addition lets a stakeholder see that creator CPL and paid social CPL aren't directly comparable until someone adjusts for what each one actually includes. You should pay particular attention to the exclusivity window here, since it's the cost most likely to get left off entirely because no invoice itemizes it, even though it carries real value for the brand.
Adding creator-level and post-level breakdowns that let stakeholders make keep-or-cut decisions
A report that only shows campaign-level totals leaves out the exact information a VP of Revenue needs to decide which creators to renew, which to cut, and where the next dollar should go. Creator-level and post-level breakdowns are the layer of the template where decisions actually get made.
Every creator should get a single row showing total investment in that creator, impressions delivered to ICP-matching titles, clicks to landing page, combined self-reported and UTM-tracked leads, sales-accepted leads, influenced pipeline, and CPL, all laid out horizontally so comparing creators takes one glance rather than a cross-reference. Underneath each creator's row, add a post-level sub-table, and it shows which specific pieces of content drove the strongest consideration and commercial signals. This is the level where the argument about audience fit versus follower count stops being theoretical: a creator with a smaller following but a higher ICP match rate will show a lower CPL at the post level than a creator with triple the followers and a mismatched audience. The data makes that case without anyone needing to argue it.
A renewal recommendation column, marked continue, pause, or renegotiate, based on each creator's CPL measured against the campaign benchmark, gives the whole report an action layer finance and revenue leadership can use without a follow-up meeting. The same creator-level view also has a practical safeguard built in: if a creator edits or deletes a high-performing post mid-campaign, a scenario that creates risk whenever a creator later disagrees with how their content was used, the row-level record is what shows what was live, when, and what it had already produced.